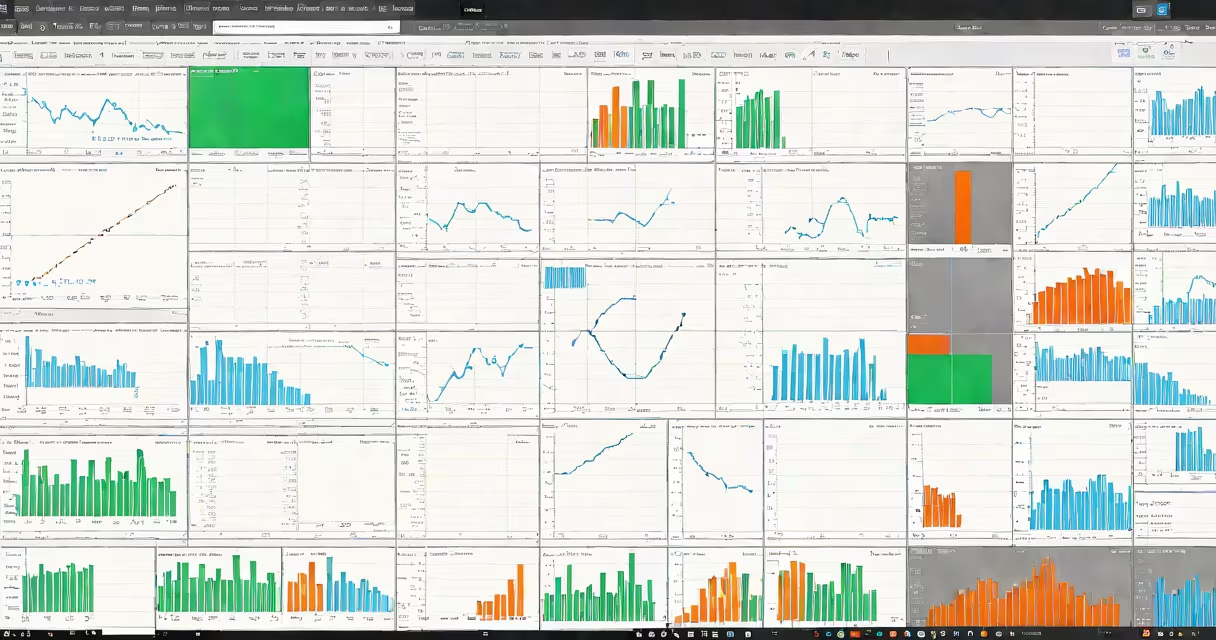
Excel is a spreadsheet application developed by Microsoft that enables users to organize, calculate, analyze, and visualize data using rows and columns. It is part of the Microsoft Office set and widely used in business, finance, education, and personal productivity.
At its core, Excel stores data in a grid of cells arranged in rows (numbered) and columns (lettered). Each cell can contain numbers, text, formulas, or functions. When you enter a formula like =SUM(A1:A10), Excel automatically calculates the total of values in those cells. This changing calculation updates instantly if any input changes.
Excel supports complex operations through built-in functions such as VLOOKUP, INDEX-MATCH, IF statements, and statistical tools like regression and pivot tables. These features allow users to automate tasks, generate reports, and model scenarios-such as projecting sales growth based on historical data.
Excel operates on a system of interdependent calculations. When you modify a value in one cell, any formula referencing that cell recalculates immediately. This real-time responsiveness makes it ideal for budgeting, forecasting, and tracking performance metrics.
For example, suppose you track monthly sales in column A (A2:A13) and expenses in column B. You can create a formula in C2: =A2-B2 to compute profit per month. Copying this formula down the column applies it to all rows. If you later adjust the expense in row 5, the profit in C5 updates automatically.
Advanced users use macros written in Visual Basic for Applications (VBA) to automate repetitive actions. A macro can format a report, import data from a database, or generate a PDF version of a worksheet-all with a single click.
Excel exists in multiple forms, each tailored to different environments:
| Version | Platform | Use Case | Key Feature |
|---|---|---|---|
| Desktop (Windows/Mac) | Windows, macOS | Full-featured work, complex models | Supports VBA, advanced charting, Power Query |
| Web (Excel Online) | Browser, mobile | Collaboration, quick edits | Real-time co-editing, cloud storage via OneDrive |
| Mobile App | iOS, Android | On-the-go access | Touch-friendly interface, limited functionality |
The desktop version remains the most useful, especially for financial analysts and accountants who rely on detailed data modeling. The web version excels in team settings where multiple people need to view or edit a file simultaneously.
Microsoft released Excel for iPad in 2021 with enhanced touch controls and support for Apple Pencil. It includes nearly all core features available on Windows, though some advanced tools like Power Pivot remain desktop-only.
Businesses use Excel for payroll processing, inventory management, and project timelines. For instance, a retail manager might use Excel to track weekly sales by product category, apply conditional formatting to show underperforming items, and generate a bar chart to show trends over time.
Financial professionals build financial models to forecast cash flow. One model might assume a 5% annual revenue increase and a 3% cost rise. By changing input assumptions, they can see how profits shift under different scenarios-a process known as sensitivity analysis.
A non-obvious fact: Excel uses IEEE 754 floating-point arithmetic, which means it cannot represent all decimal fractions exactly. For example, entering 0.1 + 0.2 returns 0.30000000000000004 due to binary representation limits. This affects precision in financial calculations and requires careful handling in high-stakes applications.
I once built a tax projection tool for a small business using Excel. After setting up depreciation schedules and income categories, I discovered discrepancies in the final balance. The issue stemmed from rounding errors in intermediate steps. Switching to Excel's ROUND function on key outputs corrected the mismatch. This taught me that even basic math in Excel isn't always intuitive.
Excel is not a database. While it can store large datasets, it lacks relational integrity, indexing, and transactional safety. Attempting to manage customer records or order histories in Excel leads to duplication, inconsistent data, and difficulty scaling.
It is also not a replacement for dedicated analytics platforms like Tableau or Power BI. These tools offer better visualization, interactive dashboards, and integration with enterprise systems. Excel serves as a front-end for data entry and initial analysis, but not for long-term data governance.
Some confuse Excel with Google Sheets. Both handle spreadsheets, but differences matter. Google Sheets runs entirely in the browser, supports real-time collaboration out of the box, and integrates tightly with Gmail and Drive. However, Excel offers deeper functionality, better performance with large files, and offline access. For complex modeling, Excel remains the standard.
According to Microsoft's official documentation, Excel supports over 400 functions, including financial, logical, and engineering tools (Microsoft Support). The National Institute of Standards and Technology (NIST) has validated Excel's numerical accuracy for many common operations, though it warns against relying on it for scientific-grade precision (NIST).
Despite its age-first released in 1985-Excel remains the dominant spreadsheet tool. As of 2023, over 1 billion devices run Excel globally, according to Microsoft's internal usage reports.
Understanding how Excel works isn't just about knowing formulas-it's about recognizing its strengths and limitations. building a multi-year business plan, Excel delivers speed, flexibility, and widespread compatibility. Its enduring presence stems not from being perfect, but from solving real problems effectively.