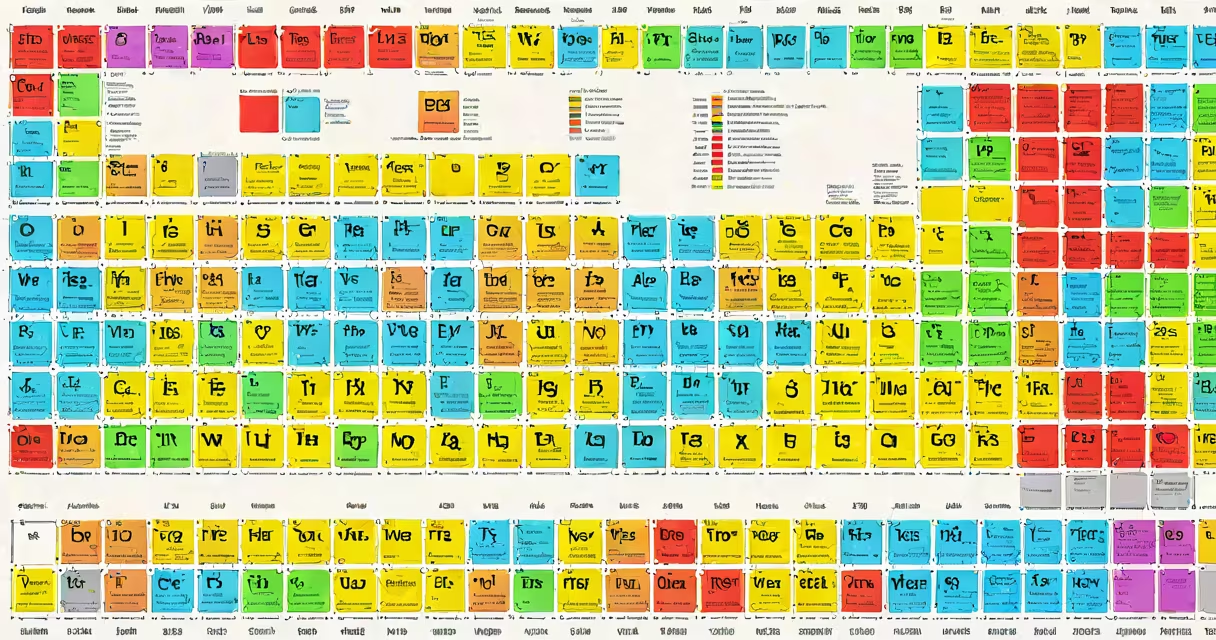
A map of periodic table is a structured visual representation of all known chemical elements arranged by increasing atomic number, electron configuration, and recurring chemical properties. It groups elements into rows (periods) and columns (groups), revealing trends in reactivity, electronegativity, and metallic character across the elements.
The periodic table's layout reflects decades of experimental and theoretical work in atomic physics and chemistry. Dmitri Mendeleev first published a version in 1869, leaving gaps for undiscovered elements he predicted based on missing patterns. Modern versions include all 118 confirmed elements, with the most recent additions-oganesson (element 118), nihonium (113), moscovium (115), tennessine (117)-verified by the International Union of Pure and Applied Chemistry (IUPAC).
Each square contains an element's symbol, atomic number, and average atomic mass. The arrangement places metals on the left, nonmetals on the right, and metalloids along a diagonal boundary. This spatial logic allows chemists to predict how elements will behave in reactions, such as sodium's violent reaction with water or fluorine's extreme reactivity.
The periodic table organizes elements into seven horizontal rows called periods and 18 vertical columns called groups. Elements in the same group share similar valence electron configurations and thus exhibit comparable chemical behaviors. For example, Group 1 (alkali metals) all form +1 ions and react vigorously with water.
Elements are also classified into four main blocks based on their outermost electron shell: s-block (Groups 1-2), p-block (Groups 13-18), d-block (transition metals, Groups 3-12), and f-block (lanthanides and actinides). These blocks correspond to the subshell being filled: s, p, d, or f. The f-block is often shown separately below the main table due to space constraints.
Periodic trends emerge across the table. Electronegativity increases from left to right across a period and decreases down a group. Ionization energy follows the same pattern. Atomic radius decreases across a period and increases down a group. These trends explain why lithium reacts more slowly with water than cesium, despite both being alkali metals.
While the standard periodic table is rectangular, several alternative designs exist to emphasize different aspects of element relationships. The spiral form arranges elements in a continuous loop, highlighting continuity across atomic numbers. The circular or radial layout centers hydrogen and places heavier elements outward, emphasizing periodicity as a cycle.
Some educational and research tools use color-coded tables to show categories:
| Color | Element Type | Examples |
|---|---|---|
| Blue | Alkali metals | Lithium, sodium, potassium |
| Green | Transition metals | Iron, copper, zinc |
| Red | Halogen group | Fluorine, chlorine, bromine |
| Purple | Noble gases | Helium, neon, argon |
| Gray | Metals (other) | Aluminum, lead, tin |
These color schemes help students identify element families quickly. The Royal Society of Chemistry's official periodic table uses this system, which aligns with IUPAC recommendations for consistent classification.
Many assume the periodic table is static or complete. It is not. New elements are synthesized in particle accelerators, and their placement depends on predicted electron configurations. For example, element 119 has not yet been synthesized, but theoretical models suggest it would belong to Group 1, continuing the alkali metal trend.
Another error is believing that all elements in a group behave identically. While they share general traits, exceptions exist. For instance, nitrogen forms stable diatomic molecules (N₂), while phosphorus exists as P₄ tetrahedra. This difference arises from orbital hybridization and bond strength variations within the group.
A lesser-known fact: the periodic table's current format was standardized in 1985 by IUPAC. Prior versions varied widely in layout and labeling. The modern version includes systematic names for elements beyond uranium-like ununpentium (now tennessine)-to maintain consistency during discovery.
Engineers use the map of periodic table to select materials for semiconductors. Silicon (atomic number 14) lies in Group 14 and has a band gap ideal for electronic devices. Gallium arsenide (GaAs), formed from gallium (31) and arsenic (33), is used in high-frequency circuits because its band structure outperforms silicon in certain conditions.
In medicine, technetium-99m (Tc-99m), derived from molybdenum (Mo, 42), is used in over 80% of diagnostic nuclear scans. Its position in the d-block explains its ability to form multiple oxidation states, essential for binding to biological targets.
I once used a custom-printed map of periodic table during a high school lab to teach students about ion formation. We matched colored stickers to elements based on their expected charge. When a student placed a sticker for calcium (Group 2) as +2, another asked why aluminum (Group 13) wasn't +3. That moment revealed a deeper misunderstanding: group number doesn't always equal common ionic charge. Aluminum forms Al³⁺, yes-but it also exhibits covalent bonding in compounds like AlCl₃, which deviates from typical ionic behavior.
Understanding the map of periodic table requires familiarity with atomic structure. The periodic table's design reflects quantum mechanical principles-specifically the Aufbau principle, Pauli exclusion principle, and Hund's rule. These govern how electrons fill orbitals, determining an element's position.
For deeper insight into element behavior, explore the concept of effective nuclear charge and shielding. As you move across a period, inner electrons shield outer ones less effectively, increasing attraction between nucleus and valence electrons. This explains why atomic radius shrinks across a period.
The map of periodic table remains a foundational tool in science. It transforms abstract atomic data into actionable insights across chemistry, materials science, medicine, and environmental engineering. Its enduring relevance lies not in perfection, but in adaptability-continuing to evolve as new elements are discovered and new properties are measured.