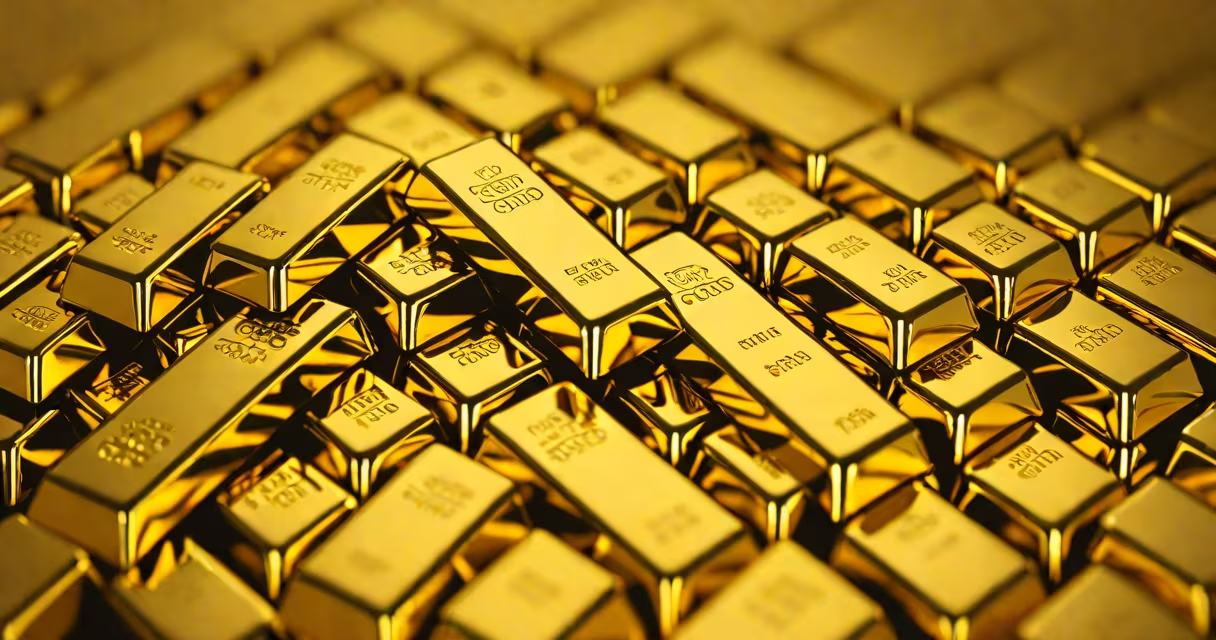
The market value for gold is the current price at which gold trades on global commodity exchanges, driven by supply, demand, and macroeconomic factors such as inflation, interest rates, and currency strength. It reflects real-time transactions in bullion, futures, and ETFs, not theoretical or historical estimates.
Gold's market value is quoted in U.S. dollars per troy ounce. As of May 2024, the average spot price hovered around $2,320 per ounce, though it fluctuates hourly based on trading volume and geopolitical events. This price is not set by a single entity but emerges from continuous bidding across markets like the London Bullion Market Association (LBMA) and COMEX in New York.
Unlike stocks or bonds, gold has no yield. Its value stems entirely from perceived scarcity, industrial use (electronics, dentistry), and role as a safe-haven asset during financial stress. Central banks hold gold as reserve currency; the U.S. Federal Reserve, for example, holds over 8,000 metric tons, worth approximately $260 billion at current prices.
Two primary mechanisms set the market value for gold: spot pricing and futures trading. The spot price represents immediate delivery at current market rates. It's updated every 30 seconds through electronic trading platforms like Bloomberg and Reuters, aggregating bids and offers from major dealers worldwide.
Futures contracts allow traders to bet on future prices. These trades influence expectations, which feed back into spot prices. For example, if investors anticipate rising inflation, they buy gold futures, pushing up both futures and spot prices. A 2023 study by the World Gold Council found that 72% of institutional investors increased gold holdings during periods of high inflation, directly affecting short-term value.
Physical demand also shapes value. India and China together account for nearly half of annual global gold consumption. In India, weddings and festivals drive seasonal spikes-demand can rise 40% during Diwali. When physical buying surges, local premiums increase above the global spot price, creating regional price divergence.
Not all gold valuations are equal. The market value for gold differs between raw bullion, jewelry, and investment-grade coins. Understanding these categories prevents mispricing.
| Type | Market Value Basis | Typical Premium Over Spot | Example Price (May 2024) |
|---|---|---|---|
| 1-ounce gold bullion bar | Spot price + small dealer margin | 1-2% | $2,345/oz |
| Gold jewelry (18k, 75% purity) | Spot price × purity × craftsmanship fee | 15-30% | $2,700/oz equivalent |
| U.S. American Eagle coin (1 oz) | Spot price + minting cost + collector demand | 5-10% | $2,440/oz |
For instance, a 1-ounce American Eagle coin priced at $2,440 includes a $110 premium over the $2,330 spot rate. That extra cost covers government minting fees, security features, and collector interest. Selling the coin later may net less than purchase price due to bid-ask spread and resale risk.
A key distinction often missed: spot price ≠ retail price. Retail sellers add markup for overhead, insurance, and profit. A jeweler selling a 10-gram necklace at $1,800 may claim it's "just" $180 per gram, but the actual gold content is worth only $145 at spot price. The difference covers labor, design, and brand value.
Many assume gold's value is stable or predictable. In reality, it moves rapidly. On March 15, 2020, during the early pandemic market panic, gold spiked from $1,550 to $1,700 in two days-a 10% jump in 48 hours-driven by flight-to-safety demand. Conversely, in late 2022, gold dropped 12% over three months as the U.S. Federal Reserve raised interest rates aggressively, making bonds more attractive.
Another myth: gold always rises during crises. While it often acts as a hedge, it doesn't guarantee gains. During the 2008 financial crisis, gold fell 25% in Q4 2008 before rebounding. The drop occurred because investors sold assets to cover margin calls, including gold, despite its safe-haven status.
Some confuse market value with intrinsic value. Gold has no inherent utility beyond decoration and electronics. Its worth comes entirely from collective belief and institutional trust. Unlike oil, which powers economies, gold serves no functional purpose. Yet, central banks still hold it because it's universally accepted and immune to counterparty risk.
Suppose you own 50 troy ounces of 24-karat gold bullion. To calculate the market value:
If you sell through a dealer, expect a 2-3% discount off spot. Net proceeds would be ~$114,000. This illustrates why liquidity matters-value isn't realized until sale.
I once bought 10 gold bars in 2018 at $1,250/oz. By 2023, the spot price reached $2,000/oz. My holdings were worth $20,000 more-yet I didn't sell. The market value had risen, but my capital wasn't unlocked until I traded. This gap between paper value and cash realization is critical for investors.
Reliable sources include the LBMA Gold Price, published twice daily in London time. It's audited and used as a benchmark by banks and ETFs. The World Gold Council provides monthly reports on central bank activity and mining output-key drivers of long-term value.
For real-time tracking, platforms like Kitco.com or Bloomberg display live spot prices with charts showing 1-hour, 1-day, and 1-year trends. These tools show volatility: gold moved ±3% in a single day on four occasions in 2023, according to data from the Commodity Futures Trading Commission.
When evaluating gold investments, compare the market value for gold against inflation-adjusted returns. From 1971 to 2023, gold returned 6.7% annually, outperforming U.S. Treasury bonds but lagging S&P 500 returns. However, during high-inflation years like 1980 and 2022, gold rose 15% and 11% respectively-proving its role as a buffer.
Understanding the market value for gold requires separating perception from price. It's not a static number. It's a changing outcome shaped by global trade, policy shifts, and human psychology. Monitoring it closely helps avoid overpaying at retail or missing exit points during turbulence.