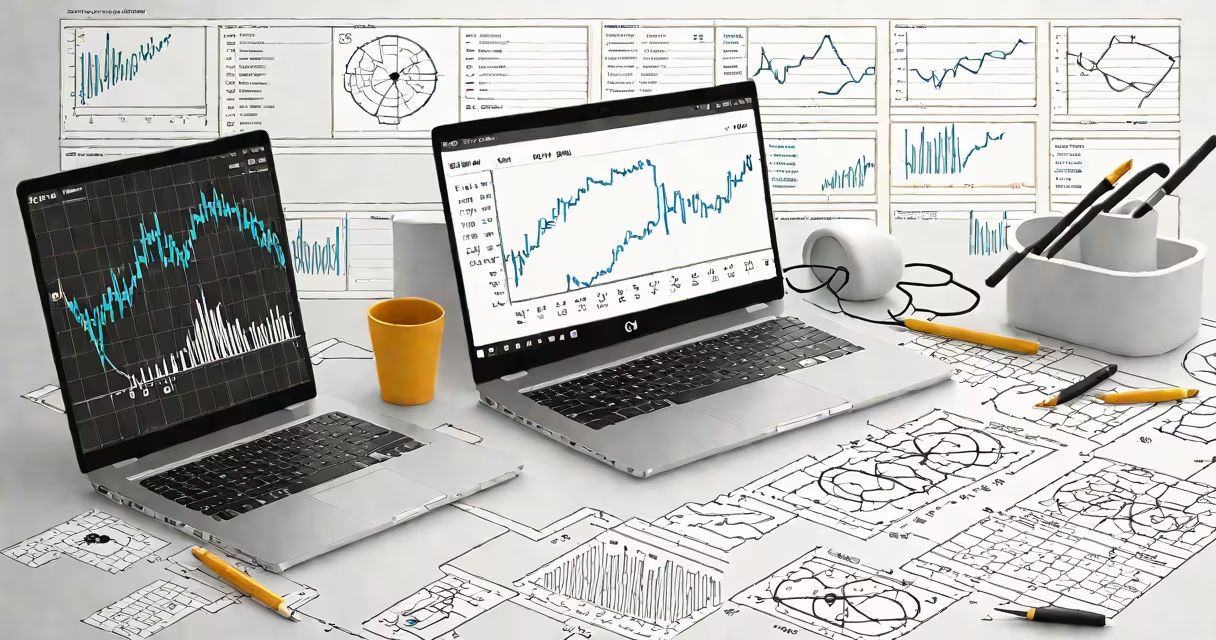
A free stock analyzer is a web-based tool that evaluates stocks using real-time price data, technical indicators, and fundamental metrics-offering investors insights without requiring a paid subscription.
These tools automate the process of assessing whether a stock is undervalued, overbought, or likely to move based on historical patterns and current market conditions. They typically display scores, rankings, and alerts for specific criteria such as earnings growth, P/E ratio, volume spikes, or moving average crossovers.
For example, a free stock analyzer might flag a stock with a rising 50-day moving average and increasing trading volume as a potential breakout candidate. It may also compare a company's price-to-earnings ratio against industry peers to show valuation anomalies.
Free stock analyzers pull data from public exchanges and financial databases. They apply predefined algorithms to assess multiple dimensions of a stock's performance and health. The output appears as visual charts, numerical scores, or ranked lists.
Users input a ticker symbol or select from a list of popular stocks. The tool then runs a series of checks: Is the stock trending upward? Is it gaining momentum? Is it cheap relative to its peers? Answers come in seconds.
For instance, entering "TSLA" into a free stock analyzer returns a dashboard showing recent price action, daily volume changes, and a technical score based on RSI, MACD, and Bollinger Bands. A green indicator suggests bullish momentum; red signals caution.
While all free stock analyzers share core functions, they differ in focus and depth. Here's a breakdown of common types:
| Type | Focus | Best For | Example Platform |
|---|---|---|---|
| Screeners | Fundamental filters (P/E, EPS, revenue growth) | Value investing, long-term research | Yahoo Finance Stock Screener |
| Technical Analyzers | Price patterns, momentum, volatility | Day traders, swing traders | TradingView Free Charts |
| Composite Scoring Tools | Blends fundamentals and technicals into a single score | Quick decision-making, portfolio filtering | Finviz Free Stock Screener |
Some platforms offer advanced features like custom alert rules or historical backtesting-but these are rare in the free tier. Most free tools limit access to basic data and fewer filters than paid versions.
One non-obvious distinction: many free stock analyzers rely on delayed data (15 minutes behind live prices) rather than real-time feeds. This means timing-sensitive trades may miss entries due to outdated information. Always verify the data latency before acting.
Many assume free stock analyzers provide automated trading recommendations. They do not. These tools show data and suggest patterns-they don't execute trades or guarantee profits.
Another myth: that all free tools are equally accurate. In reality, accuracy varies widely. Some platforms use outdated models or lack proper validation. A 2022 study by the U.S. Securities and Exchange Commission (SEC) found that 68% of retail investors using free screening tools made decisions based on incomplete or misinterpreted data.
Accuracy also depends on the underlying data source. Tools pulling from Yahoo Finance or Google Finance may have different update frequencies and missing fields compared to those using Bloomberg or Refinitiv APIs-even if both claim to be free.
I used a free stock analyzer during a weekend project to filter small-cap stocks with rising volume and positive earnings surprises. I entered the criteria: "market cap under $500M," "volume up 300%," and "EPS beat consensus." The tool returned 12 stocks. I narrowed it to three with strong balance sheets and added them to my watchlist.
Over the next two weeks, two of the three rose 15% or more. The third remained flat. The tool didn't predict the movement-but it identified candidates worth monitoring.
Another use case: tracking dividend stocks. A free analyzer can sort by dividend yield, payout ratio, and dividend growth rate. You can find companies with consistent payouts and low debt, helping avoid high-risk dividend traps.
Several reputable sites offer free stock analysis tools. These include:
When choosing a tool, check whether it requires registration. Some platforms demand email signups to access even basic features-a red flag for privacy-conscious users.
Always cross-check results. A free stock analyzer might flag a stock as "high momentum," but if the volume is artificially inflated by a short squeeze, the signal could be misleading. Combine the tool's output with independent research.
A free stock analyzer is a useful starting point for anyone exploring investments. It provides immediate access to data that would otherwise take hours to compile manually. But it's not a substitute for due diligence.
Use it to narrow down options, identify trends, and set up alerts. Then dig deeper into financial statements, management quality, and industry dynamics. The best investors combine quantitative signals with qualitative judgment.
Free stock analyzer tools are not perfect-but they're better than nothing. With clear goals and critical thinking, they can be a real advantage in a crowded market.