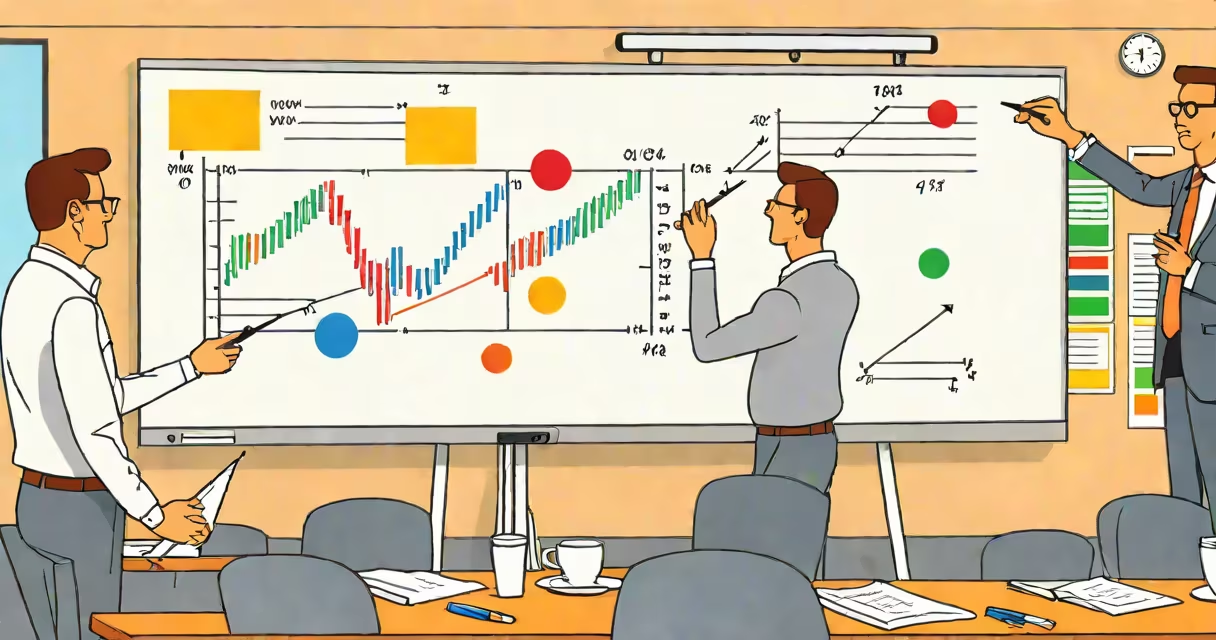
A technical analyst course trains individuals to predict future price movements in financial markets using historical price data, volume, and statistical indicators. These courses cover chart patterns, trendlines, moving averages, and oscillator tools to assess market sentiment and timing.
Technical analysts study price action rather than fundamentals like earnings or balance sheets. They assume that all relevant information-economic conditions, investor psychology, news-is already reflected in the price. The goal is to spot recurring patterns and anticipate shifts in supply and demand.
These courses typically span 40 to 120 hours, delivered online or in person. Topics include candlestick formations, Fibonacci retracements, relative strength index (RSI), MACD, Bollinger Bands, and risk management principles. Completion often leads to certification from organizations like the CMT Association or the International Federation of Technical Analysts (IFTA).
Technical analysis relies on the idea that prices move in trends and that history repeats itself due to consistent human behavior. Traders use visual representations of price data-charts-to detect patterns indicating potential reversals or continuations.
For example, a "head and shoulders" pattern on a daily chart may suggest a bearish reversal. A rising trendline support level breaking below signals weakening bullish momentum. Traders combine multiple indicators to confirm signals and reduce false positives.
Modern courses integrate software platforms like TradingView, MetaTrader 4, or Thinkorswim. Students learn to draw trendlines, apply moving averages, and backtest strategies using historical data. Real-time simulations allow learners to practice without risking capital.
Technical analyst courses vary by depth, focus, and credentialing. Here's a breakdown of common formats:
| Type | Duration | Focus | Credential Offered |
|---|---|---|---|
| Introductory | 10-20 hours | Basic chart reading, common patterns, simple indicators | Non-certified completion certificate |
| Intermediate | 40-60 hours | Advanced patterns, multi-timeframe analysis, strategy development | Associate-level certification |
| Advanced/Professional | 100+ hours | Statistical modeling, algorithmic trading, quantitative methods | CMT (Chartered Market Technician), IFTA accreditation |
Some programs emphasize specific markets-forex, equities, commodities-or timeframes such as intraday or swing trading. Courses tailored for retail traders differ from those designed for institutional analysts who use high-frequency data and complex models.
One key distinction: technical analysis is not forecasting. It doesn't predict what will happen-it identifies probable outcomes based on past behavior. A well-designed technical analyst course emphasizes probability, not certainty.
Many people confuse technical analysis with fundamental analysis. While fundamental analysis evaluates a company's financial health, revenue growth, and industry position, technical analysis focuses solely on price and volume data. Both approaches exist independently, though many professionals use them together.
Another error is treating technical indicators as infallible. RSI above 70 doesn't guarantee a sell signal-especially in strong uptrends. False breakouts occur frequently. A solid technical analyst course teaches risk control, position sizing, and stop-loss placement to manage losses when signals fail.
There's also a myth that technical analysis is purely subjective. In reality, it uses measurable criteria. For instance, a "double top" pattern requires two peaks at similar levels, confirmed by a close below the neckline. This structure can be coded into a trading algorithm.
In 2022, during a volatile period in the S&P 500, a student in a technical analyst course identified a descending triangle pattern on the weekly chart of Apple Inc. (AAPL). The pattern formed over six months, with lower highs and a flat support zone near $145.
When the price broke below $145 on high volume, the student entered a short position. The trade was stopped out at $138, capturing a 5.5% gain in under three weeks. The course had taught that breakouts from consolidation patterns often lead to continued moves in the direction of the breakout.
This outcome wasn't guaranteed-but the setup met objective criteria. The student didn't rely on gut feeling. They applied rules learned in the technical analyst course, including volume confirmation and trendline validation.
I once ran a small group workshop where participants analyzed Tesla's stock from 2020 to 2021. We used daily candlestick charts and applied Bollinger Band squeezes. When the bands narrowed and price broke above the upper band with strong volume, we flagged it as a potential breakout. Over the next 14 days, the stock rose 22%. The course material helped us recognize the signal early.
Investment firms, hedge funds, and retail brokers use technical analyst course graduates to evaluate entry and exit points. Day traders rely on real-time charts and indicators to make rapid decisions. Portfolio managers use technical signals to time sector rotations or rebalance holdings.
According to the CMT Association, over 15,000 professionals worldwide hold CMT certification. These individuals work at major banks, asset management firms, and independent advisory practices. The demand for trained analysts remains steady, especially in emerging markets where algorithmic trading adoption is growing.
Online platforms like Coursera, Udemy, and Investopedia offer structured technical analyst courses. Some include live webinars, peer review, and access to trading simulators. The most effective ones provide hands-on exercises with real market data, not just theory.
Most courses teach "how to read charts." Few explain why certain patterns work. A deeper insight: successful technical analysis depends on market structure, not just pattern recognition.
For example, a flag pattern in a strong uptrend has higher odds of continuation than one appearing after a sharp decline. Context matters. A technical analyst course that includes market regime classification-trending vs. ranging markets-gives students a structure to assess reliability.
Research from the Journal of Behavioral Finance (2021) shows that traders using context-aware technical rules achieve 18% better win rates than those relying on isolated indicators. This is rarely covered in beginner courses.
When choosing a technical analyst course, prioritize programs that include scenario-based learning, real-time data access, and feedback on trade journals. Avoid those promising "guaranteed profits" or claiming to replace fundamental analysis entirely.
A technical analyst course equips you with tools to analyze market behavior objectively. It doesn't eliminate risk-but it gives you a structured way to assess probabilities and act with discipline.