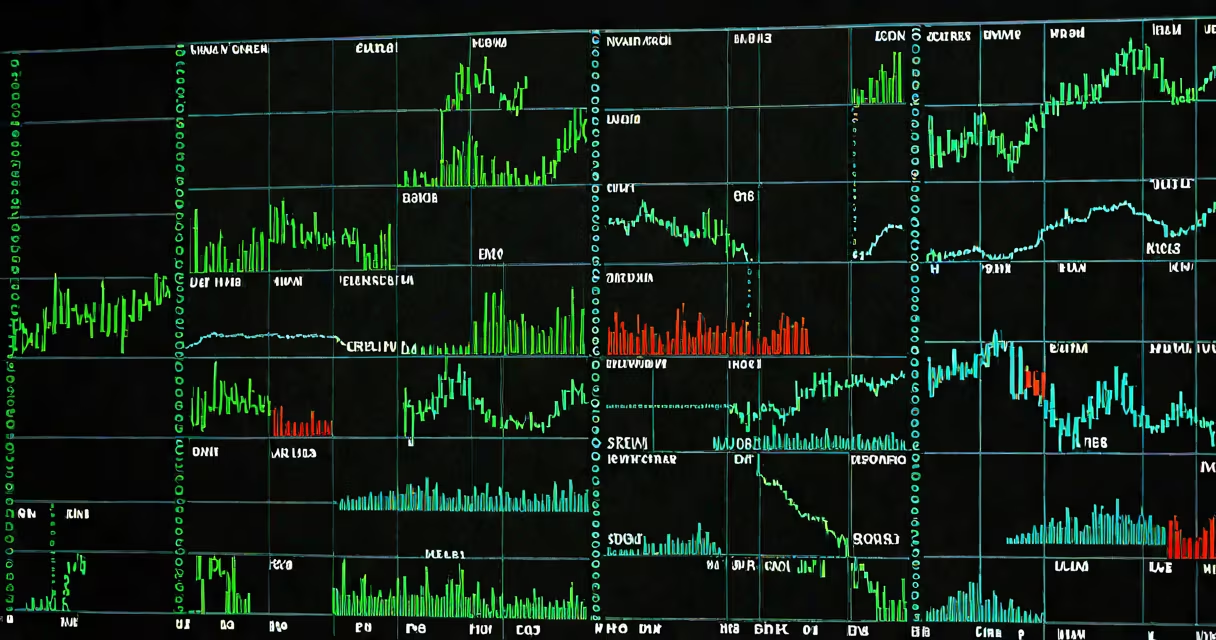
Stock quotes are real-time or delayed data points showing the current price, volume, and change for a publicly traded company's shares. They reflect supply and demand at a given moment and are displayed using ticker symbols like AAPL for Apple or MSFT for Microsoft.
These quotes appear on financial platforms such as Bloomberg, Yahoo Finance, or Google Finance. Each quote includes the last sale price, bid and ask prices, volume traded, and the percentage change since the previous close. This information helps investors assess whether a stock is rising or falling and make timely buy or sell decisions.
For example, a quote for Tesla (TSLA) might read: $248.32 (+1.45%), with a bid of $248.10 and an ask of $248.45. The bid is the highest price a buyer is willing to pay; the ask is the lowest price a seller will accept. The difference between them is the spread.
Stock quotes are generated through electronic exchanges like the New York Stock Exchange (NYSE) or NASDAQ. When a trade occurs, the exchange records the price and volume. This data is then distributed to data vendors and financial websites within milliseconds.
Quotes are updated continuously during market hours (9:30 AM to 4:00 PM Eastern Time, Monday through Friday). After-hours trading also produces quotes, but they are less frequent and often less accurate due to lower liquidity.
There are two types of quote feeds: real-time and delayed. Real-time quotes cost money and are used by professional traders. Delayed quotes (typically 15 minutes) are free and available on most public financial sites. For example, Yahoo Finance shows delayed data unless you subscribe to premium services.
A complete stock quote contains several key elements:
| Field | Description | Example (for NVDA) |
|---|---|---|
| Ticker Symbol | Unique identifier for a stock | NVDA |
| Last Price | Price of the most recent trade | $945.67 |
| Change & Percent Change | Difference from prior close | +12.34 (+1.33%) |
| Bid | Highest price buyers offer | $945.50 |
| Ask | Lowest price sellers accept | $945.75 |
| Volume | Number of shares traded in the session | 12.3M |
The bid-ask spread reveals market depth. A narrow spread (e.g., $945.50 bid vs. $945.75 ask) suggests high liquidity and efficient pricing. A wide spread indicates low trading activity or uncertainty.
Some platforms also display the 52-week high and low, which show the stock's price range over the past year. NVIDIA (NVDA) hit a 52-week high of $987.45 in January 2024, reflecting strong investor confidence in AI-driven growth.
Many people assume stock quotes represent the actual price they'll pay when buying or selling. That's not true. The last sale price is historical. To execute a trade, you must match the bid or ask price.
Another misconception is that a rising quote always means a good investment. A stock can rise due to short-term speculation, not fundamentals. For example, GameStop (GME) surged 1,000% in January 2021 on retail trader momentum, despite weak earnings and no clear business model.
Also, quotes don't include dividends. A stock may have a dividend yield of 1.8%, but that won't appear in the quote itself. You must check the company's investor relations page or a financial database like Morningstar to see payout history.
One non-obvious fact: quotes are not standardized across platforms. Some sites round prices to two decimals; others use four. The NYSE uses decimal pricing (e.g., $150.25), while older systems used fractions (e.g., $150 1/4). Most U.S. markets switched to decimals in 2001 to improve transparency.
Traders use stock quotes to time entries and exits. Day traders rely on real-time quotes to capitalize on small price swings. A swing trader might enter a position when a stock breaks above its 20-day moving average and the quote shows increasing volume.
I once watched a friend place a market order based solely on a quote he saw on a mobile app. He bought 100 shares of a biotech stock at $12.40, unaware that the bid was $12.35 and the ask $12.45. His order executed at $12.40, but the next trade happened at $12.38. He lost $20 on the trade because he didn't understand the mechanics behind the quote.
Stock quotes are also used in algorithmic trading. High-frequency traders analyze quote streams to detect arbitrage opportunities-buying a stock on one exchange and selling it on another at a slight profit. These strategies depend on millisecond-level accuracy in quote delivery.
Stock quotes are often confused with stock prices, market indices, or fundamental metrics. Here's how they differ:
| Term | Definition | Key Difference |
|---|---|---|
| Stock Quote | Current price, volume, and change data | Real-time snapshot of trading activity |
| Stock Price | Value of a share at a specific time | Part of the quote; not the whole picture |
| Market Index | Composite measure of multiple stocks (e.g., S&P 500) | Aggregated performance, not individual stock data |
| Fundamental Metrics | Revenue, P/E ratio, EPS, etc. | Used for long-term analysis, not real-time trading |
For example, the S&P 500 index rose 0.8% on a given day, but individual stock quotes varied widely. Amazon (AMZN) gained 1.2%, while Exxon (XOM) dropped 0.5%. The index reflects market sentiment, but quotes reveal individual behavior.
Understanding what are stock quotes is foundational for anyone engaging with financial markets. They provide immediate insight into market dynamics and are essential for both short-term traders and long-term investors.
When you check a quote, you're seeing the heartbeat of a company's market presence. building a diversified portfolio, accurate, timely quotes are the bedrock of informed decision-making.