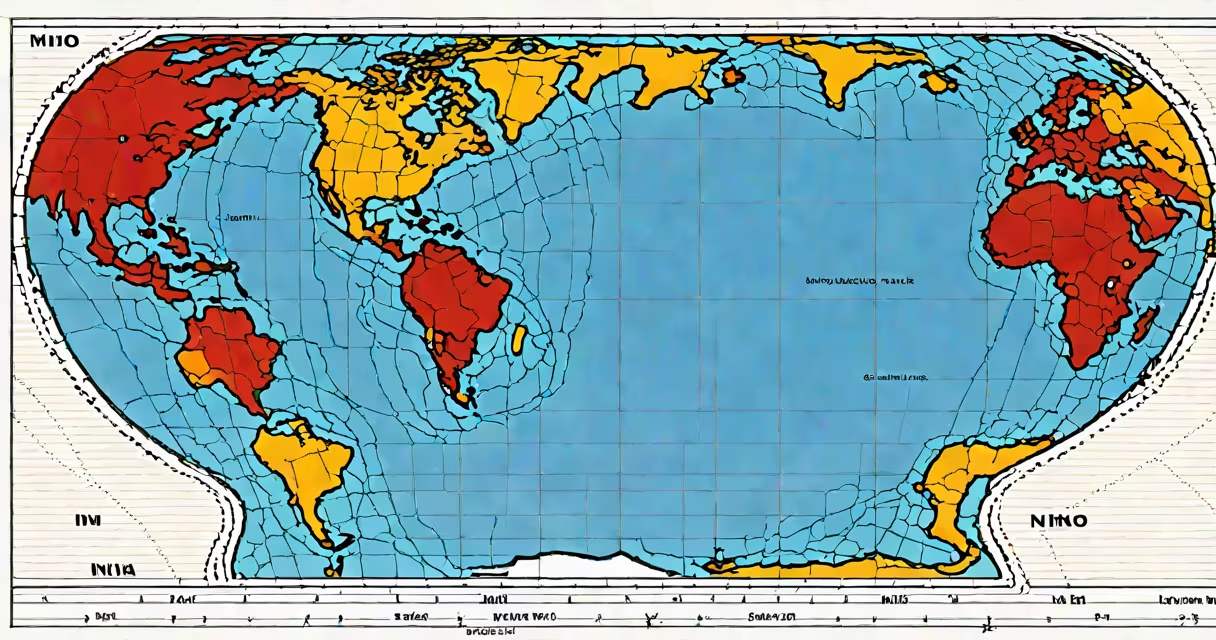
El Niño and La Niña are opposite phases of a recurring climate pattern in the tropical Pacific Ocean that alters global weather, sea surface temperatures, and atmospheric circulation. They occur every 2 to 7 years and can last 9 to 12 months, influencing rainfall, storm activity, and temperature extremes worldwide.
These phenomena are part of the El Niño-Southern Oscillation (ENSO), a natural cycle involving changes in ocean temperatures and wind patterns across the equatorial Pacific. During El Niño, warm water shifts eastward toward South America, weakening trade winds and disrupting normal rainfall patterns. In contrast, La Niña features stronger-than-average trade winds and cooler-than-normal ocean temperatures in the eastern Pacific, intensifying rainfall in Southeast Asia and Australia while increasing drought risk in parts of the Americas.
The term "El Niño" means "The Little Boy" in Spanish, referencing its discovery around Christmas by Peruvian fishermen who noticed warmer waters disrupting fish populations. "La Niña," meaning "The Little Girl," was coined later to describe the colder phase. These names reflect the seasonal timing of early observations but do not imply gendered behavior in climate systems.
At the heart of both events lies a shift in the Walker Circulation-a large-scale atmospheric loop driven by temperature differences between the western and eastern Pacific. Under normal conditions, warm water pools in the western Pacific near Indonesia, creating rising air and heavy rain. Cooler water in the east supports sinking air and dry conditions along the South American coast.
During El Niño, weakened trade winds allow warm surface water to move eastward. This reduces upwelling-the process bringing cold, nutrient-rich water to the surface-and causes sea surface temperatures in the central and eastern Pacific to rise by 1-3°C above average. The resulting atmospheric pressure changes alter jet stream paths, leading to wetter winters in the southern United States and drier conditions in Indonesia and northern Australia.
La Niña strengthens the usual pattern. Trade winds intensify, pushing warm water westward and allowing cold water to upwell along the South American coast. Sea surface temperatures drop 1-2°C below average in the eastern Pacific. This enhances convection over the western Pacific, increasing monsoon rains in India and Southeast Asia and boosting hurricane activity in the Atlantic due to reduced wind shear.
El Niño and La Niña are categorized by strength: weak, moderate, and strong. The strongest events have measurable global impacts. The 1997-1998 El Niño was one of the most intense on record, causing $35 billion in damages globally according to NOAA. It triggered severe flooding in California, droughts in Indonesia, and widespread coral bleaching across the Pacific.
| Phase | Sea Surface Temperature Anomaly | Trade Wind Strength | Typical Global Effects |
|---|---|---|---|
| El Niño | +0.5°C to +3°C | Weakened | Wetter U.S. Southwest, drought in Australia, increased Pacific hurricanes |
| La Niña | -0.5°C to -2°C | Strengthened | Drier U.S. Southwest, enhanced monsoons in Asia, more Atlantic hurricanes |
California experiences the most direct weather changes. During strong El Niño events, the state sees a 60-70% increase in winter precipitation compared to average. The 2015-2016 El Niño brought record snowpack to the Sierra Nevada and helped end a multi-year drought. Conversely, La Niña often correlates with below-average rainfall, contributing to wildfire risk and water shortages.
Global agriculture suffers under extreme ENSO events. A 2022 study published in Nature Climate Change linked La Niña conditions to a 15% decline in maize yields across sub-Saharan Africa due to delayed planting seasons and prolonged dry spells. Meanwhile, El Niño-driven floods in Peru disrupted fishing and damaged infrastructure, affecting food security in coastal communities.
El Niño and La Niña are not caused by climate change, though warming oceans may affect their frequency and intensity. The World Meteorological Organization (WMO) reports that ENSO cycles existed long before industrial emissions, based on coral and tree ring records dating back 700 years. However, recent research suggests climate change may increase the likelihood of extreme events.
A common error is conflating El Niño with global warming. While both involve rising temperatures, El Niño is a regional ocean-atmosphere interaction lasting months, not a long-term trend. A single El Niño event can raise global average temperatures by 0.2°C temporarily, but this effect fades within a year.
Another confusion arises between ENSO and other climate patterns like the Indian Ocean Dipole or Arctic Oscillation. These operate independently and can amplify or dampen ENSO effects. For example, during the 2015-2016 El Niño, a concurrent positive Indian Ocean Dipole intensified rainfall over East Africa, worsening floods in Somalia and Kenya.
In January 2023, a moderate El Niño developed, supported by NOAA's Oceanic Niño Index (ONI), which measures sea surface temperature anomalies. By February, the National Weather Service reported a 75% chance of above-average precipitation in Southern California. Rainfall totals reached 12 inches in Los Angeles County-double the monthly average-and triggered mudslides in Ventura County.
This event illustrates how El Niño's influence extends beyond meteorology into public safety, infrastructure planning, and resource management. Accurate forecasting allows agencies to prepare for flood risks, allocate emergency funds, and coordinate evacuations.
While both are part of the same climate system, their effects differ sharply. El Niño brings warmth and moisture to the tropics and subtropics, often increasing storm activity in the Pacific and Atlantic basins. La Niña enhances atmospheric stability in the central Pacific, favoring stronger trade winds and more frequent tropical cyclones in the western Pacific.
For decision-makers in agriculture, disaster response, and energy planning, distinguishing between the two is critical. Farmers in Brazil adjust planting schedules based on ENSO forecasts. Power grid operators in Texas monitor El Niño signals to anticipate winter demand spikes. Insurance companies use historical ENSO data to model risk exposure across regions.
I once monitored a 2019 La Niña event using real-time satellite data from NASA's Aqua and Terra missions. When I saw the cold tongue extending from the equator toward the Galápagos Islands, I confirmed the onset of La Niña. That week, I updated a local weather advisory for Central America, warning of potential drought in Nicaragua and Honduras. The forecast held true-rainfall dropped 40% below average in those areas over the next three months.
El Niño and La Niña explained: they are natural oscillations in the Pacific Ocean that reshape global weather patterns. Their impacts span ecosystems, economies, and human safety. Understanding them helps societies prepare for extreme conditions, manage resources, and respond effectively to climate-related risks.
Recognizing the difference between El Niño and La Niña enables better forecasting and planning. With accurate models and historical data, scientists and policymakers can mitigate disruptions and adapt to changing climate dynamics.